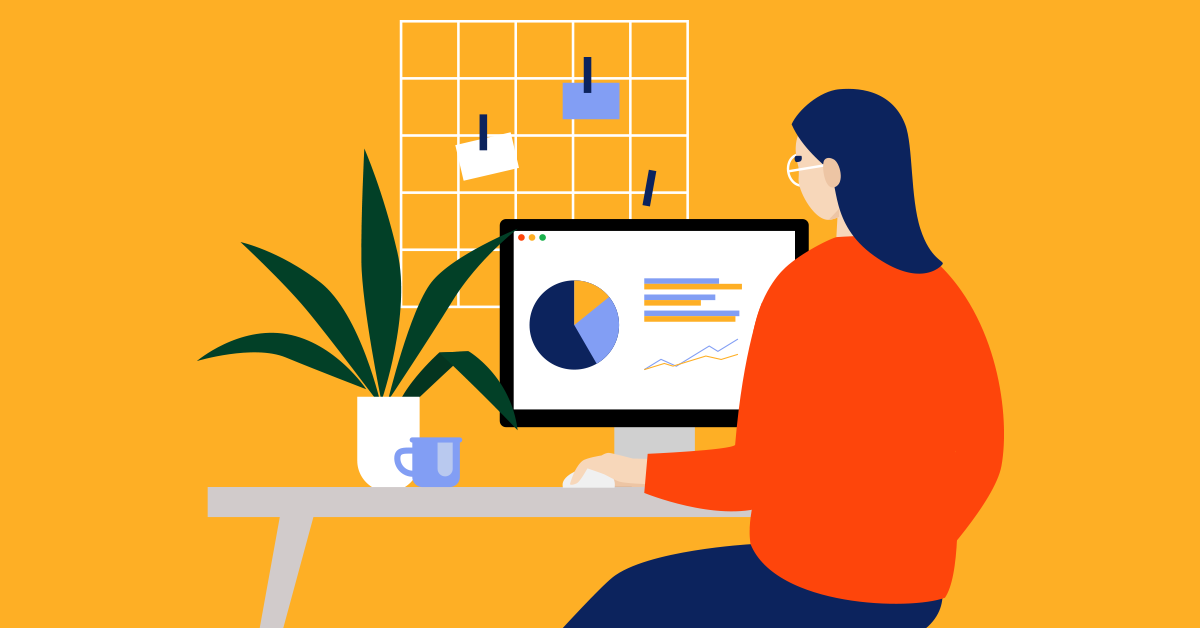
How do you make decisions for your business? Do you rely on gut instinct? Traditional knowledge? How do you measure success? How about failure? How do you quantify growth?
Retail analytics and reporting helps you go back up your instincts and confidently make decisions. Data helps you set realistic goals for your retail store, and can help you respond to changes in customer behavior.
To help get you acquainted with retail analytics, let’s go over:
- What is retail analytics
- Why analytics are important for retailers
- How to get started with retail analytics
Let’s get started!
While the retail sector reopens across North America, owners and operators face a whole new set of challenges. Download our free playbook and learn how to diversify sales and build a more resilient business post-pandemic.Reinvent your business for the future
What is retail analytics?
In a nutshell, retail analytics is the use of data to measure the performance of a retail operation. These measurements help merchants make better decisions for the health and longevity of their business.
Retail analytics goes beyond just checking sales figures and profits at the end of the day. It’s also useful for all aspects of inventory management, accounting, cash flow management, employee scheduling and much more.
Why is analytics important for retailers?
Having a way to concretely measure sales, inventory and employee performance is crucial to optimizing your operations in a post-COVID world.
Relying on traditional knowledge and sales data gathered before the pandemic is risky. In the face of changing customer behavior, those conclusions aren’t as reliable as they once were.
Using data since the pandemic hit will help you adapt quickly and optimize how you run your business with greater accuracy.
Analytics also help you understand what’s going on with your business in much greater detail than you could otherwise. Here are a few examples of other insights that analytics can uncover:
- The value and number of products sold in an average order
- Which products sell the most, the least and everything in between
- See sales by the hour to understand your in-store conversion rates
- Your top and least selling employees
Armed with these insights, you can better understand the metrics of your business and implement strategies that help you get to where you want to go faster than you could otherwise. For example, you can staff your best salespeople during your peak sales hours to drive more revenue, improve cash flow by stocking more of the products that sell the best and fewer of the ones that sell the least or institute a customer loyalty program to enhance your customer retention and customer satisfaction efforts.
How retail analytics impacts inventory management
Let’s say, for example, you wanted to ensure your inventory purchasing plans were reactive to your customers’ needs and buying habits since mid-March.
Inventory forecasting based on data would help you make those decisions. You could start by diving into the quantitative date: measuring sales numbers across categories, compiling weekly averages for a month to get a snapshot of their purchasing habits. Next, look at qualitative information: looking at trends, reading expert opinions and reading both primary and secondary research.
We’re big fans of using Google Trends as well. With this free tool, you can see approximately how many people are searching for a particular product or service online, which can be super handy when buying inventory for your store.
Once you know what’s selling well and what isn’t, you could use software like Lightspeed Analytics to run reports like recently out of stock with sales and dusty inventory to further understand how your inventory is (or isn’t) selling.
The recently out of stock with sales report tells you exactly that—what products you’re sold out of that have recent sales, signaling they’re products that are potentially resonating well with your customer base. A dusty inventory report tells you the opposite, as it returns results on inventory that hasn’t sold at all within a set time frame, signaling what products aren’t hitting home with your customers at all.
With retail analytics, you can prepare yourself to react to changes in your business sooner. Because you’d be relying on current sales data, you’d have relevant results that you can trust—if anything has drastically changed from your customers’ pre-pandemic buying habits, you’ll know sooner rather than later.
You can put the insights you learn from inventory retail analytics into practice with reorder points so that you never have too much or too little inventory item on hand. Between category performance data and results from a recently out of stock with sales report, you could discern which products are selling well enough that you need to keep on top of their stock levels, and potentially adjust how often you’re ordering or how much. Then, you could review your dusty inventory results to see what there’s a decreased demand for in your store.
When you’re picking new products to stock in your store, you can check your data; products similar or complementary to your best-sellers will likely go over better than products related to those on your dusty inventory list.
Spot trends and opportunities to inform your decision-making with Lightspeed Analytics.Become a data whiz (maths skills not required)
How retail analytics helps measure sales targets
Retail analytics can help you set realistic targets for employees and maximize sales during opening hours as you welcome customers back into your store.
You could start by measuring your sales by hour of the day for the last month. This would tell you your peak hours and days—given how much has changed thanks to COVID and social distancing, these peak periods may not be the same as they were pre-pandemic. Heck, you might be making more sales through your online store than at your physical location. These analytics help you answer some questions about your new operating hours:
- Are there any consistently dead periods? If you’re making significantly less sales after 6:00 PM on weekdays, is it worth it to temporarily reduce your opening hours?
- Are there any peak periods that consistently coincide with shifts by any particular sales associates? Can those associates pass on their knowledge of useful selling techniques to the rest of your staff?
Once you’ve got that data in hand, you can start deciding on what else you want to measure to set your new targets.
Let’s say, for example, you’d like to increase customer capture rate—the rate at which your employees are recording a customer’s contact information at the time of sale—so that you can be sure your email newsletters and customer communications are reaching as many people as possible.
You could start by running a customer capture rate report in your analytics software—Lightspeed Analytics has this report built-in—to see how well your team are performing at the moment. Then, you’d set your first target goal; perhaps your team is currently capturing contact information on 55% of all sales, and you’d like to increase that to 75% of all sales by the end of the quarter. To set your employees up for success, give them a refresher on how to ask customers for their contact information and consider adding an incentive for providing an email address, such as 5% off their purchase.
You could re-run your report again in three weeks to see how steadily the customer capture rate is increasing. If it’s slower than you expected, ask yourself: do your employees need more training? Do your customers need better incentives to provide contact information? Whatever you decide to do, keeping on top of targets with retail analytics means you can act proactively, not reactively, to help your team succeed.
Key retail analytics concepts
There are a number of key concepts and measurements that you’ll get acquainted with as you dive into retail analytics. One important concept is your GMROI—your gross margin return on investment, calculated by dividing your gross profit by your average inventory cost. By measuring your GMROI, you can see if the products you’re selling are turning a profit above your inventory costs. The higher your GMROI, the better; keeping an eye on this measurement can help you inform your inventory purchasing plans and your sales strategies.
Another important measurement in retail analytics? Your conversion rate—the number of transactions divided by the number of people who visited your store in a set amount of time. By measuring your conversion rate, instead of only measuring transaction count or traffic, you get a deeper understanding of the activity in your store.
Calculating your daily conversion rate across the last few weeks tells you not only your best performing sales days, but which days attract the most traffic—and which attract the least. Once you have that data in hand, you can start to make decisions that increase visits on low-traffic days and sales on high-traffic days, instead of trying a one-size-fits-all approach to increasing revenue.
Get started with retail analytics
Retailers looking to make the right moves in an unpredictable world should get acquainted with using data, because retail analytics put you in control. You no longer have to make guesses or rely on pre-pandemic knowledge—you can take current measurements and make decisions that are relevant to your new reality with data you collected.
If you’re ready to start using retail analytics, let’s chat about how Lightspeed’s Analytics suite would work for your business.

News you care about. Tips you can use.
Everything your business needs to grow, delivered straight to your inbox.